|
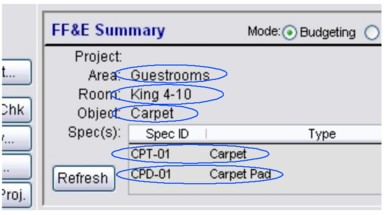
The summary area that appears on the FF&E Worksheet gives you a quick financial snapshot of the budgets, costs and prices that have been entered into the project data. It also contains the area, room, object and object components related to the currently highlighted row on the FF&E Worksheet list. These can be double-clicked to directly edit them on their data screens (see circled areas below).
|

|
|
The summary updates as you move from one Worksheet row to the next, and you can double-click the text shown to edit the "parent" records from which the information comes.
|
There are two "modes" for this display: 1) "budgeting," which shows all the budgets that have been entered and the estimated total price to the client and 2) "cost/sell" which is oriented more towards purchasing firms in which the "sell" price is compared to the cost to the purchasing firm.
Display Options
Three options can be used to control how the summary works.
|
Mode
|
The Mode option controls whether the summary shows the budgeting vs. cost/sell display.
|
|
Refresh
|
This is used to update the numbers in the summary if Auto-sum is turned off. Although the numbers are updated automatically if you use the Add or Edit buttons to make changes to the Worksheet list, when Auto-sum is disabled changes made on other forms may not appear until you click this button.
|
|
Auto-sum
|
(Located at the bottom of the screen on the Status Bar.) Use the auto-sum check-box to control how often the summary numbers are updated. Because the summary is a "live" recalculation of all the numbers you've entered, the program may not respond as quickly when it is on a network or if the project is particularly large. Unchecking this control sets the update to a semi-manual mode and causes the Refresh button (above) to appear.
|
Below are the columns that appear in each mode:
Budgeting
|
Budget
|
Budgets can be entered at the project, area and room and object level if you wish. The system will display the total budgets at each of these levels, so that the estimated price can be compared them.
|
|
Total Obj. Budgets
|
For instances where extremely thorough budgeting is required, this column shows how the totaled object budgets for the items placed in rooms compare to the budget entered for the projects, areas and rooms (first column).
|
|
Total Obj. Prices
|
In the same way that the previous column totaled the budgets for each object, this column totals the estimated price for the objects so that it can be compared to the first column. Note that these numbers will only be as accurate as the completeness of the pricing process.
|
|
% Budget
|
This column gives you an idea of how much the prices vary against the budgets.
|
Cost/Sell
|
Budget
|
This column shows the same budget numbers as in the "budgeting" mode.
|
|
Total Obj. Cost
|
This column totals the catalog costs for each object prior to adding any kind of markup.
|
|
Total Obj. Sell
|
This column totals the estimated sell price for the objects so that it can be compared to the first column.
|
|
Profit Margin
|
This column calculates the gross profit margin (not markup) at each level of the project.
|
|
